APOBEC3A is an oral cancer prognostic biomarker in Taiwanese carriers of an APOBEC deletion polymorphism
Ting-Wen Chen,Chi-Ching Lee,Hsuan Liu,Chi-Sheng Wu,Curtis R. Pickering,Po-Jung Huang et al.
Oral squamous cell carcinoma is a prominent cancer worldwide, particularly in Taiwan. By integrating omics analyses in 50 matched samples, we uncover in Taiwanese patients a predominant mutation signature associated with cytidine deaminase APOBEC, which correlates with the upregulation of APOBEC3A expression in the APOBEC3 gene cluster at 22q13. APOBEC3A expression is significantly higher in tumors carrying APOBEC3B-deletion allele(s). High-level APOBEC3A expression is associated with better overall survival, especially among patients carrying APOBEC3B-deletion alleles, as examined in a second cohort (n=188; p=0.004). The frequency of APOBEC3B-deletion alleles is ~50% in 143 genotyped oral squamous cell carcinoma -Taiwan samples (27A3B−/−:89A3B+/−:27A3B+/+), compared to the 5.8% found in 314 OSCC-TCGA samples. We thus report a frequent APOBEC mutational profile, which relates to a APOBEC3B-deletion germline polymorphism in Taiwanese oral squamous cell carcinoma that impacts expression of APOBEC3A, and is shown to be of clinical prognostic relevance. Our finding might be recapitulated by genomic studies in other cancer types.
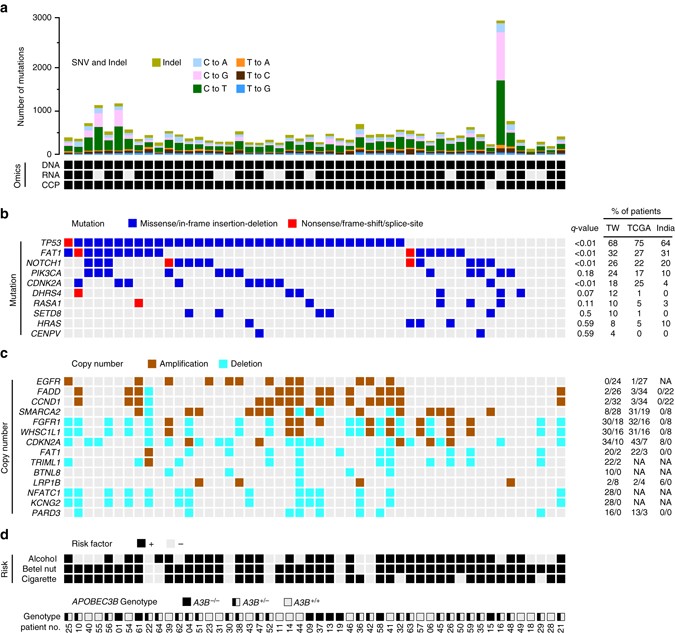
Figure1. An integrated deep-sequencing approach identifies novel variant features underlying OSCC of a unique demographic origin. Summary data for the 50 OSCC-Taiwan cases. The four blocks correspond to the different types of data attributes. They represent, from top to bottom: a Mutation analyses in a series of 50 OSCC samples. The y-axis shows the number of mutation events and the omics data (DNA exome sequencing, RNA RNA-Seq, CCPcomprehensive cancer panel), whereas the x-axis indicates the samples of the individual patients. b Heatmap representation of individual genes exhibiting somatic mutations in the 50 OSCC samples. The q-values (false discovery rates) represent the significance of each mutated gene, as determined using MutSigCV. c Heatmap representation of the copy number variations, compared with those from TCGA and India. SNVs were identified with Mutect, which applies a Bayesian classifier to detect mutations with allelic fractions of 0.1 or less ( < 10%). For the number of mutation events, the mutation types are broken down by the indicated sequence features. For the mutation b and copy number analyses c, the tables on the right show the percentages of patients with the respective somatic sequence variation or amplification/deletion, as found in the OSCC-Taiwan (TW), OSCC-TCGA (TCGA), and OSCC-India (India) cohorts. NA data not available. d The risk exposure and A3B deletion genotypes. OSCC patients with the habits of alcohol, betel nut or cigarette are individually marked. For 3 APOBEC3B genotypes, A3B −/−, A3B +/−, and A3B +/+ are shown with full, half and empty squares, respectively